Start with stint structure, not headline pace
Fans often over-index on one fast lap. A better method is to segment each run into stints, then compare trend quality over multiple clean laps.
This is why users search for "F1 lap times", "F1 telemetry", "pit stop strategy data", and "driver pace comparison" in the same session. They are trying to connect raw speed to strategy outcomes.
Trademark note: This guide is independent fan analysis. F1X is unofficial and not affiliated with Formula One World Championship Limited or FIA.
A practical 4-step lap-time framework
- Split each driver into pre-pit and post-pit stint blocks.
- Remove obvious outliers: pit in/out laps, traffic lockups, yellow-flag laps.
- Compare trend slope and median pace, not just one best lap.
- Cross-check against interval and tyre context before final conclusions.
Three sources of fake pace narratives
1. Traffic asymmetry
One driver may lose time behind slower cars while the other has clean air. Raw lap deltas then exaggerate true performance differences.
2. Tyre age mismatch
Comparing fresh and aged tyres without labeling lap age creates misleading pace claims.
3. Ignoring race-control events
Safety-car and virtual-safety-car periods reset the baseline. Your chart interpretation should account for those interrupts.
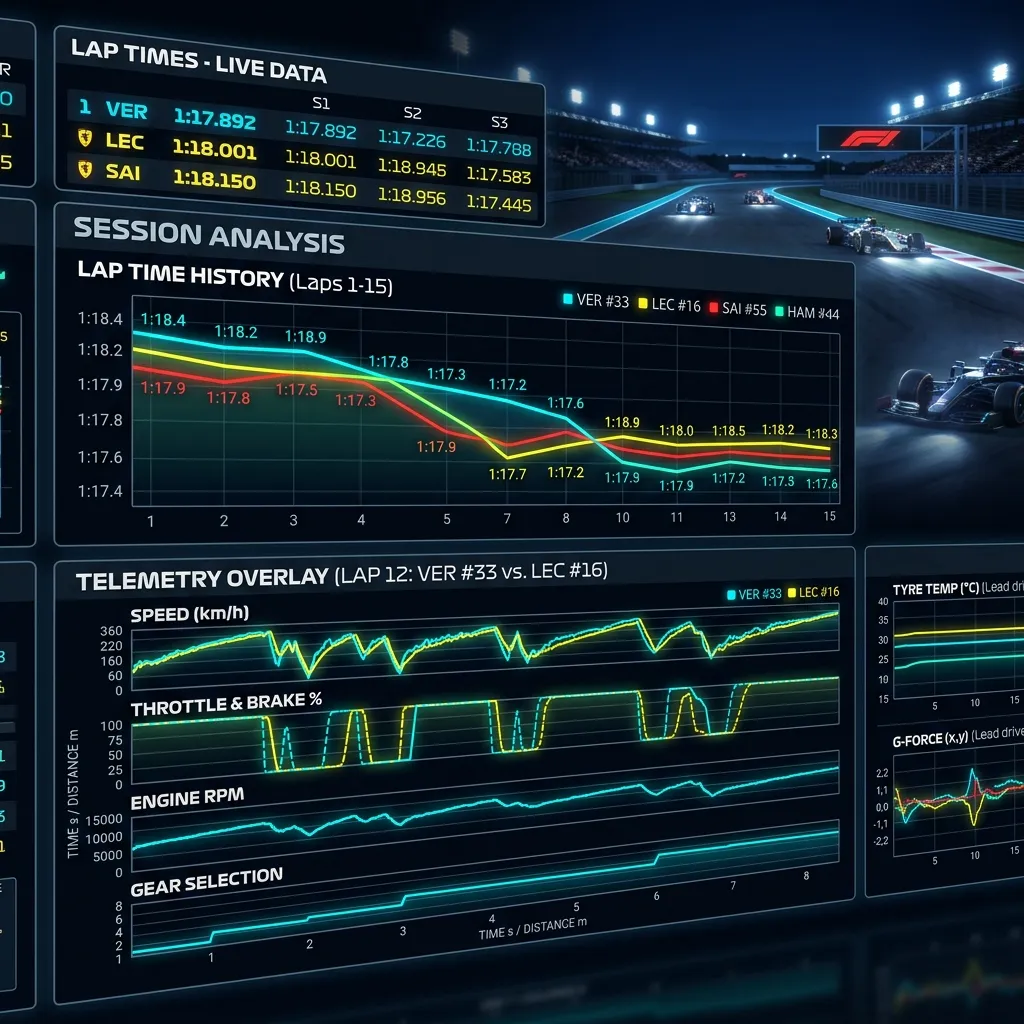
How F1x supports cleaner lap analysis
F1X includes both line and bar lap-time widgets, with controls for driver selection and filters such as hiding invalid laps and outliers. That makes it easier to move from noisy snapshots to repeatable interpretation.
During active sessions, some real-time depth can depend on current access and source timing behavior. Pair live reads with confirmed post-session context for best accuracy.
A low-stress race-day routine
Use one short loop at each race phase: check standings movement, review lap-trend direction, and validate strategy events. This keeps you informed without drowning in data churn.
FAQ
Should I prioritize fastest lap or average pace?
Average trend in clean stint windows is usually more predictive than a single headline lap.
How do I compare two drivers fairly?
Use overlap windows with similar tyre age and clean traffic, then compare medians.
Do I need advanced engineering tools?
Not always. A structured approach plus clear lap charts and race context is enough for most fans.
Turn lap charts into useful race insight
Use F1X to keep lap trends, standings, schedule, and session context together in one new tab workflow.
Add F1X